Local MLB viewership for the two-month 2020 regular season has been revealed by Forbes, and while the data itself is interesting, there are some larger questions that arise when looking at it.
First off, viewership is up around 4% (4.2%, to be exact) from the 2019 season. That’s a good thing! As we’ve mentioned on this site numerous times, any ratings or viewership number that isn’t down from last year can only be considered a positive development (pun intended).
However, local ratings were down 11%, as they have been across most sports and non-sports programming, due to changes in how Nielsen measures viewership. That isn’t great! Forbes didn’t reveal full ratings info for each team, but did note that the Red Sox (58%), Angels (40%), and Mariners (38%) had the three largest declines on the season.
Additionally, five teams were not included in the sample set – the Blue Jays (who are never included, since they’re a Canadian team), Royals, Reds, Padres, and Brewers. The four American teams are the four smallest MLB markets, and had they been included, both last year’s average viewership and this year’s would have decreased.
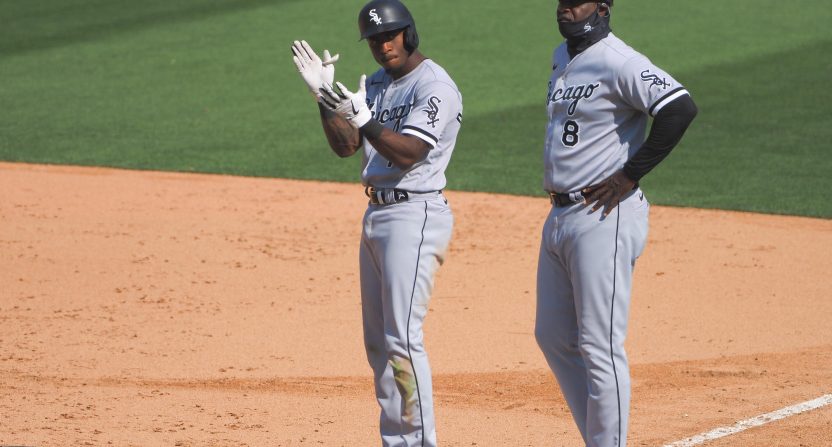
Let’s talk about biggest increases and decreases. Six teams saw average viewership increase by at least 30% this season – the White Sox (up 152% to 90k per game), A’s (up 108% to 44k a game, still the third-lowest mark among the 25 listed teams), Dodgers (up 84% to nearly 234k per game, the second-highest average viewership in the league), Giants (up 42% to 86k per game), Indians (up 34% to 141k per game), and Tigers (up 31% to 90k per game). That Dodgers increase might surprise some people, but remember: DirecTV finally carried SportsNet LA this year, six seasons after the network launched. The Dodgers and Yankees (260k per game) were the two teams to average more than 200,000 viewers per game, with the Phillies ranking close behind at 195k per game.
Four teams saw declines of at least 30%, including the aforementioned Red Sox (down 54% to 72k per game), Mariners (down 36% to 54k per game), and Angels (down 34% per game to 60k per game), along with the Pirates (down 34% to 46k per game). The Marlins (21k per game), Orioles (36k), A’s, Pirates, and Rangers (48k) all averaged under 50,000 viewers per game.
A couple of other things you should keep in mind. Remember, teams didn’t have any fans at home games this year. For teams who saw declines or small increases, where did all of those fans go? The Cardinals, for instance, had an announced average attendance of nearly 43,000 per game last year. Yet, their average viewership in 2020 went down by 3,500 viewers per game. Sure, that average includes road games as well as home games, but logic indicates that there would be some sort of increase to account for fans watching from home instead of the ballpark.
The 60-game season also helped stemmed trends, both positive and negative. Look at a team like the Diamondbacks. Their average viewership was down only 9% this year, but the team closed the season on a 12-24 run. If they played poorly (though maybe not “lose two-thirds of their games” poorly) for another 100 games, how much higher would the viewership decrease have been? Similarly, look at a team like the Braves. Their viewership was up 13% this year with a fun, young, exciting team. If the team continued to play as they did through the first 60 games, would that viewership have ticked up even further?
Overall, there are plenty of takeaways from this data. But the real conclusions will be drawn from Postseason viewership this month, and what MLB’s local viewership looks like in 2021.
[Forbes]
